
In our guide to the Lassonde Curve, we talked about the “Orphan Period”, that scary time when excitement fades and the company has to prove the project is real.
That proof comes in the form of three major technical reports.
For a retail investor, this is where dreams meet reality. It is where geologists step back and engineers step in to answer the most important question in the sector: “We found the gold, but can we actually make money digging it up?”
Understanding the difference between the three main studies, PEA, PFS, and DFS, is the single best way to manage your risk. Here is your plain-English guide to the alphabet soup of mining economics.
The Hierarchy of Confidence
1. The PEA (Preliminary Economic Assessment)
The Vibe: “Napkin Math”
The PEA is a first-pass look at the economics. It costs very little to produce (usually under $500k) and essentially answers a “what if” question. The engineers look at drill results and build a theoretical model to see if a mine could be profitable using standard methods.
However, the PEA has a massive loophole: it is the only study allowed to use Inferred Resources. These are educated guesses based on wide-spaced drilling. Because the study assumes there is gold in gaps that haven’t actually been drilled yet, PEAs are highly speculative.
Investor Warning: Never bet the farm on a PEA. It is a theoretical model with low accuracy (+/- 35% to 50%). When companies finally drill tighter to verify those guesses, the gold sometimes disappears, killing the project.
2. The PFS (Pre-Feasibility Study)
The Vibe: “The Reality Check”
This is the “Great Filter” where many junior mining projects fail. To complete a PFS, the company can no longer rely on guesses. They must upgrade their rock to Indicated Resources, meaning they have drilled close enough to be confident the gold is continuous.
This is usually the first time a company declares a Reserve. While a “Resource” means there is gold in the ground, a “Reserve” means they know they can mine it at a profit right now.
Additionally, the company must perform real metallurgical testing during a PFS. They cannot simply assume the rocks will cooperate; they have to grind up their specific ore and prove they can extract the metal without spending a fortune on chemicals.
3. The DFS (Definitive Feasibility Study)
The Vibe: “The Bankable Blueprint”
The DFS is the final manual. It is often called “Bankable” because it must be detailed enough for a commercial bank to read it and agree to lend the company hundreds of millions of dollars for construction.
At this stage, there are no more estimates. The study includes exact quotes for steel and concrete, signed agreements with local power providers, finalized environmental permits, and detailed labor costs. If a company releases a positive DFS, they are signaling that they are ready to build the mine immediately.
Comparison Table: The 3 Studies at a Glance
| Feature | PEA (Preliminary) | PFS (Pre-Feasibility) | DFS (Definitive) |
| Primary Goal | Show potential value; Marketing. | Select mining method; Risk reduction. | Final budget for financing. |
| Resource Allowed | Inferred (Guesses allowed). | Indicated & Measured only. | Indicated & Measuredonly. |
| Output | Mineral Resources. | Mineral Reserves. | Mineral Reserves. |
| Accuracy | Low (+/- 40%). | Medium (+/- 25%). | High (+/- 15%). |
| Can you build? | No. | No. | Yes. |
How to Read the Numbers (The Big Three)
No matter which PDF you are reading, scroll immediately to the “Economic Highlights” section. You need to verify three specific numbers to ensure the project is viable.
1. NPV (Net Present Value) This represents the total value of the project in today’s dollars after paying all costs. The trick here is the “Discount Rate.” The industry standard for gold is 5%. If a company uses a lower rate (like 0% or 3%), they are artificially inflating the numbers to make the project look better. Always look for the “NPV @ 5%.” Ideally, this number should be significantly higher than the company’s current market cap.
2. IRR (Internal Rate of Return) This measures the annual return on investment. It tells you how efficient the capital is. In safe jurisdictions like Canada or the USA, you generally want to see an IRR of 20% or higher. However, in risky jurisdictions like South America or Africa, you should demand an IRR of 30% to 40%. The extra return is necessary to justify the political risk of operating there.
3. Payback Period This calculation shows how many years it takes to pay off the construction debt and start making a pure profit. A payback period under 2 years is elite, while anything under 4 years is average. Be very wary of projects with a payback period over 5 years; commodity prices could crash long before you get your money back.
The Pro Tip: Sensitivity Analysis
If you want to analyze these reports like a pro, search the document for the “Sensitivity Analysis” table. This shows you how much money the mine makes if the price of gold drops. A robust project will still be profitable if gold falls to $1,600/oz. A weak project—often called a “leverage play”—might turn unprofitable if gold drops by just $100.
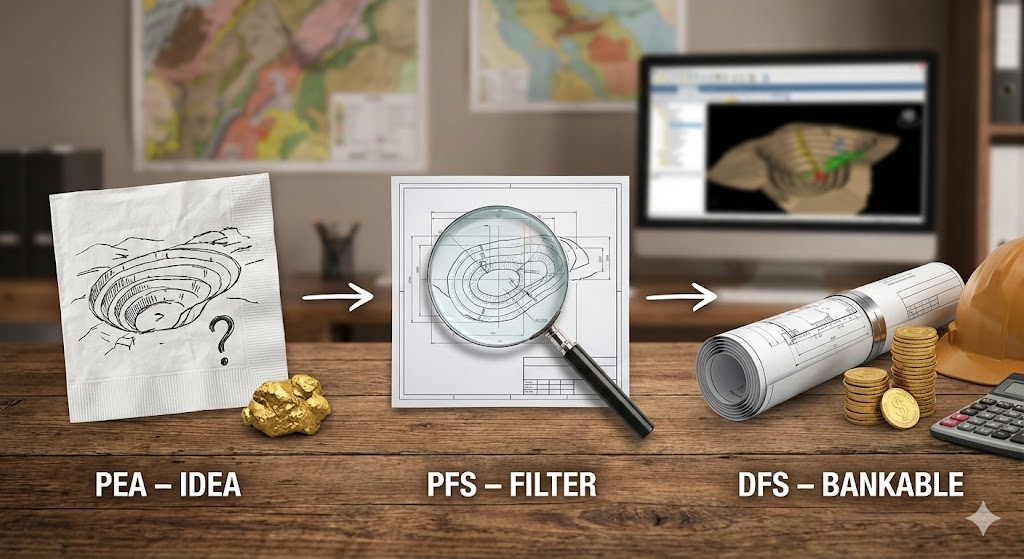
The Bottom Line: Moving from Hype to Reality
The PEA is for dreaming, the PFS is for filtering, and the DFS is for building. If you know which document you are reading, you won’t get fooled by the math.